 BS W 13:1973+A1:2014
  BS Z 17:2000
  BS Z 2:1997
  AASHTO UBA-3
  HI 9.6.5 (M122)
  BS Z 10:1998
  UOP 992-11
  BS X 36:1998
  NBBI NB23-2015 Part 2
  PIP VESST001
  AASHTO TP 98-12
 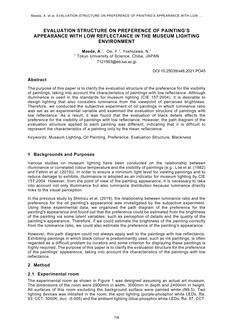 CIE x048-PO45
  ADS TS95-AR
  ISA TR84.00.08-2017
  AS Z5-1958
  AS Z5.2-1968
  ASTM Volume 15.09:2018
  ADS TS54
  BS W 14:1999
  UOP 980-17
  AS/NZS IEC 62550:2019
  AS Z38-1967
  AGA Z380112
  CIE x048-WP03
  BS Z 100:1999
  AS Z33-1967
  BS W 13:1973
Description
This experiment was carried out in an aircraft cab. Six high-power LED floodlights were used to produce five different ambient lighting conditions. The observers completed visual tasks on a display, which was set at five different luminance levels under each ambient lighting condition. Thus, each observer completed the visual tasks under 25 combinations (filter out 2 conditions) of display luminance and ambient lighting conditions, with five in each trial, with a goal to avoid the visual fatigue caused by the long experiment. For each combination, the observer performed the work performance test, visual fatigue test, and a questionnaire to rate the level of visual fatigue and visual comfort. Electro-oculogram (EOG) data was collected throughout the experiment, the Critical Fusion Frequency (CFF) test and the Near Point Accommodation (NPA) test was performed before starting the visual task to evaluate the level of visual fatigue. The observers were asked to read the Ann Fermo J correction table. The hit rate, the false alarm rate, and the duration of the reading were recorded. When the observers completed the task, the CFF and NPA was carried out again. The difference of them before and after the visual task and characterize the visual fatigue. At the end, the observers completed a questionnaire to rate their level of fatigue and visual comfort. Primary Component Analysis (PCA) was employed to evaluate the visual fatigue between four methods. According to the pilot questionnaire to determine the weight of performance, visual fatigue and visual comfort. As a conclusion the dimming curve was derived to illustrate the Optotype luminance level of the display under each ambient lighting condition.
Product Details
- Published:
- 05/01/2018
- Number of Pages:
- 11
- File Size:
- 1 file , 1.3 MB